SketchHub lets public health laboratories compare pathogen genomes with institutions
and countries around the world in real time — while the raw sequencing data
never leaves the lab that produced it.
Beta
The service is live at kssd3.genomesketchub.com and open to use today —
while still in beta, so treat results as a fast first pass and verify anything that changes a decision.
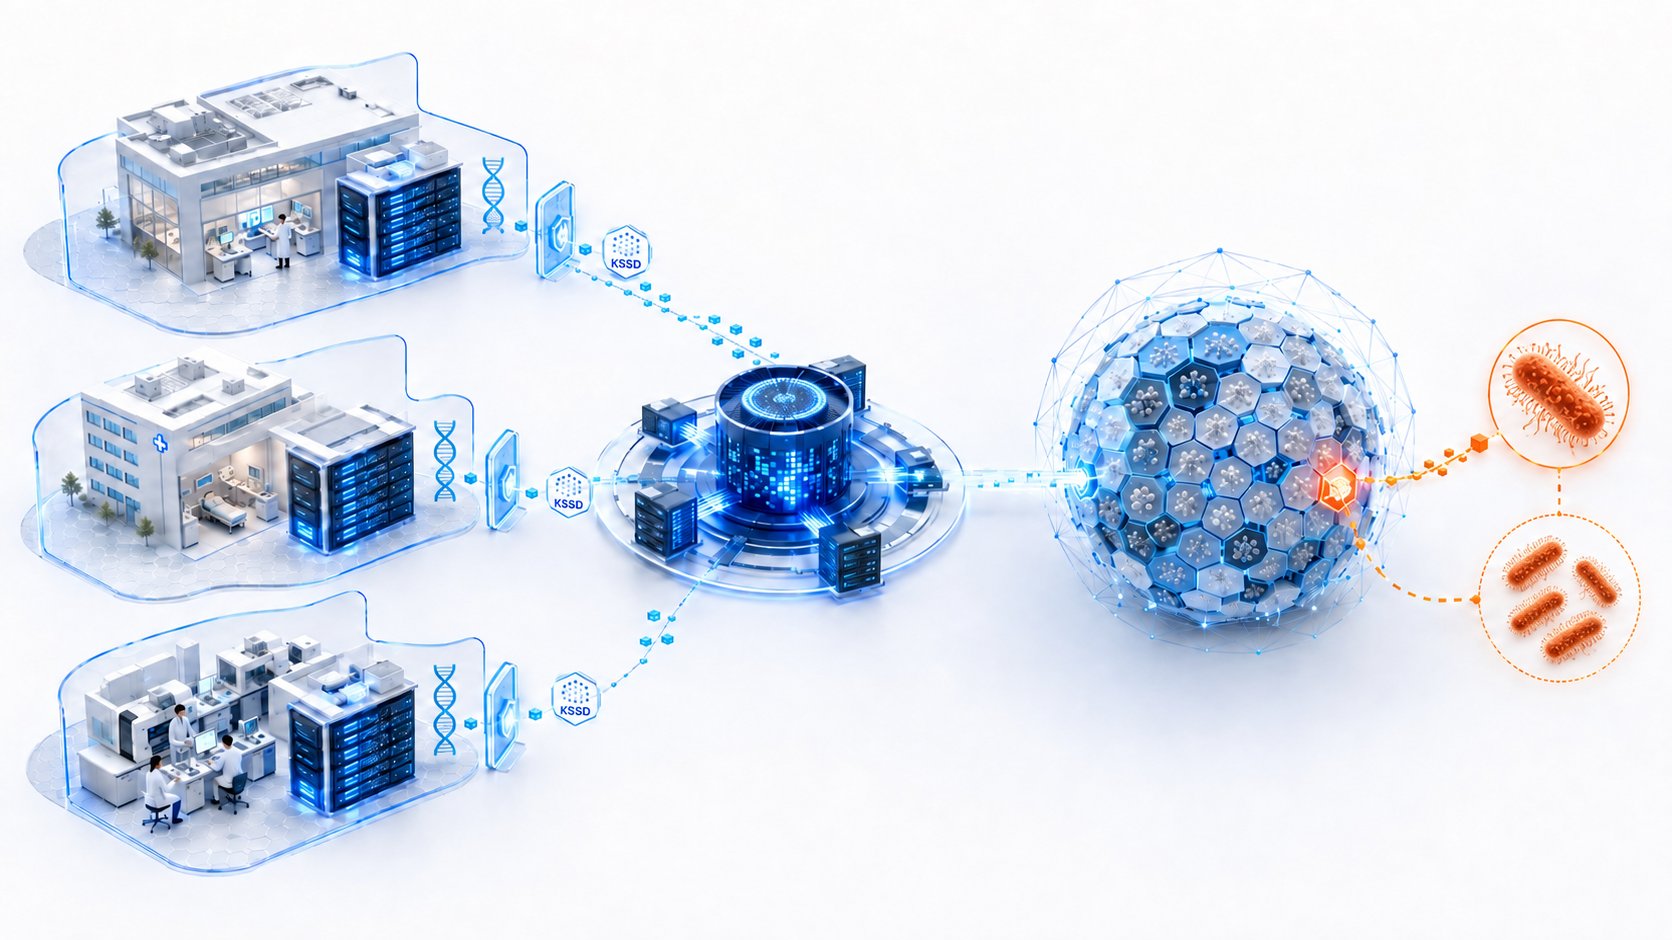
Full genomes stay on your premises. Sketches, not sequences, cross the network.
The gap
Outbreaks cross borders. Genomes stay locked in labs.
Genome sequencing is now routine in public health. But when a cluster appears, the fastest way to
understand it is to compare it against everything else that has ever been sequenced — and that
is exactly what most laboratories cannot do.
Sharing raw data is hard
Uploading reads to a central database raises legal, ethical and privacy questions. Data-sharing agreements can take weeks — an outbreak moves in days.
Answers arrive too late
By the time sequences are exchanged and re-analysed, the transmission window that mattered has usually closed.
You see only part of the picture
Without a global reference, a local cluster looks like an isolated event. You cannot tell whether it is new, imported, or already spreading elsewhere.
The idea
Three simple ideas
SketchHub changes what has to be shared. Instead of moving genomes, it moves a tiny
mathematical summary — and does the comparison for everyone at once.
01
Raw data stays home
Your reads and assemblies never leave your network. They stay under your jurisdiction,
your ethics approvals and your data-protection rules.
Secure & compliant by design
02
Real-time across the network
A sketch is small enough to send in seconds. Institutions on the network can compare
against each other continuously, not once a quarter.
Answers in seconds
03
Compare with other users
Match your sample against public reference genomes and against the private data of
partner institutions that have authorised you — and see who else has seen the same strain.
Public + authorised private data
How it works
Four steps, one of them leaves your building
Click through the steps to see exactly what happens to your data.
Step 1 · On your premises
Your sequencing pipeline, unchanged
Run your normal workflow on your own instruments and servers. SketchHub accepts the
FASTA or FASTQ files you already produce — no re-sequencing, no reformatting, no
new hardware.
sample_042.fastqassembly.fasta
At this point nothing has left your network. You are still fully in control of the sequence.
Step 2 · On your premises
A sketch is a summary, not a copy
The KSSD3 algorithm samples roughly one in every 256 positions of the k-mer space and
builds one compact sketch from them. The output is a small fingerprint of the sample.
Raw sequence100%
Sketch~0.4%
Bar widths are illustrative; the real ratio is about one part in 256.
A sketch is a summary, not a copy. It is derived from your data, and it is far smaller than the sequence it came from.
Step 3 · Crossing the network
Kilobytes, not gigabytes
The sketch is transmitted over an encrypted connection. It is small enough to send
from a field lab over a modest link, and it can be regenerated at any time from the
original data.
raw reads — stay local
↓
sketch.k = 4.2 KB — travels
Each transfer is logged, so your institution can always show what was sent, to whom, and when.
Step 4 · Back to you
Matches, clusters and resistance profile
The sketch is compared against the public reference index and against every partner
collection you are authorised to search. You receive strain-level placements with
confidence scores, geography, dates and resistance markers.
Results are exportable in open formats, so they drop straight into your existing reporting.
The boundary
Exactly what crosses the line
This is the part that matters most to data-protection officers and ethics committees.
Nothing in the left-hand column ever moves.
Stays on your premises
Your data
Never transmitted, never stored elsewhere, never re-shared.
Raw sequencing reads and assemblies
Your internal analysis and reports
Travels to the index
A sketch
A compact summary of the sample, built on your own machine.
A sampled k-mer profile
Typically a few kilobytes per sample
You choose who is allowed to match against it
What you get
Real output, not a concept
These are actual screens from the live service — the results a laboratory sees
after submitting a sample. Click any screen to enlarge it.
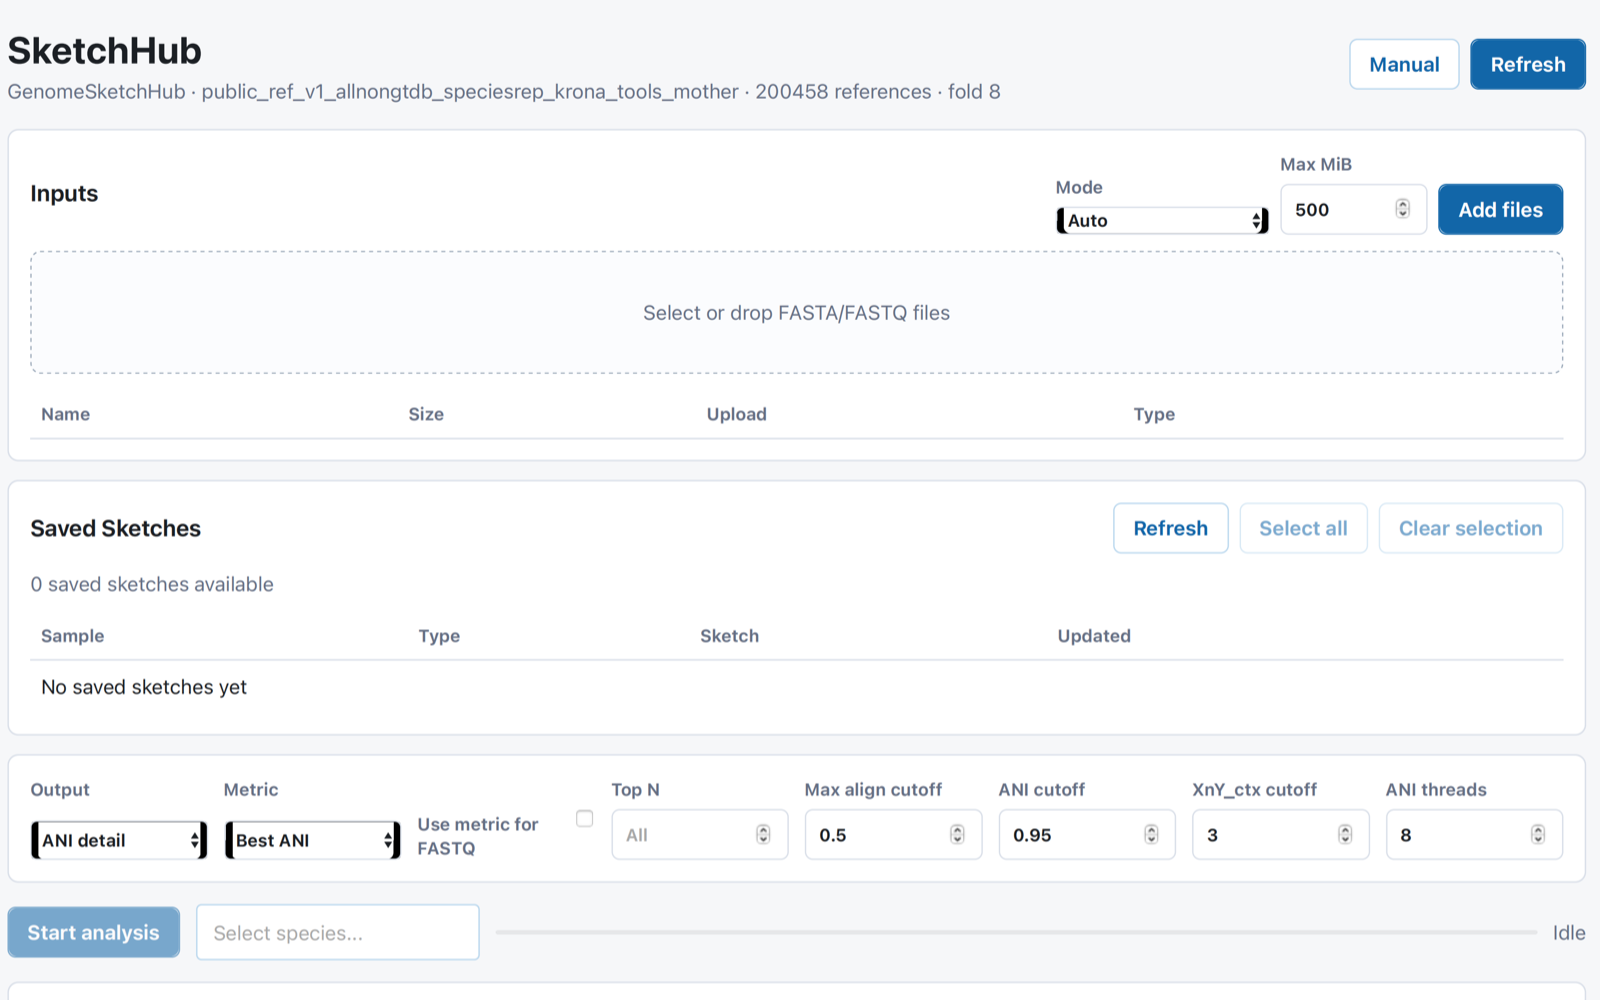
Console
Submit a sample in one screen
Drop in FASTA/FASTQ files, choose a reference index and start the analysis. 200,458 reference genomes available in the current public index.
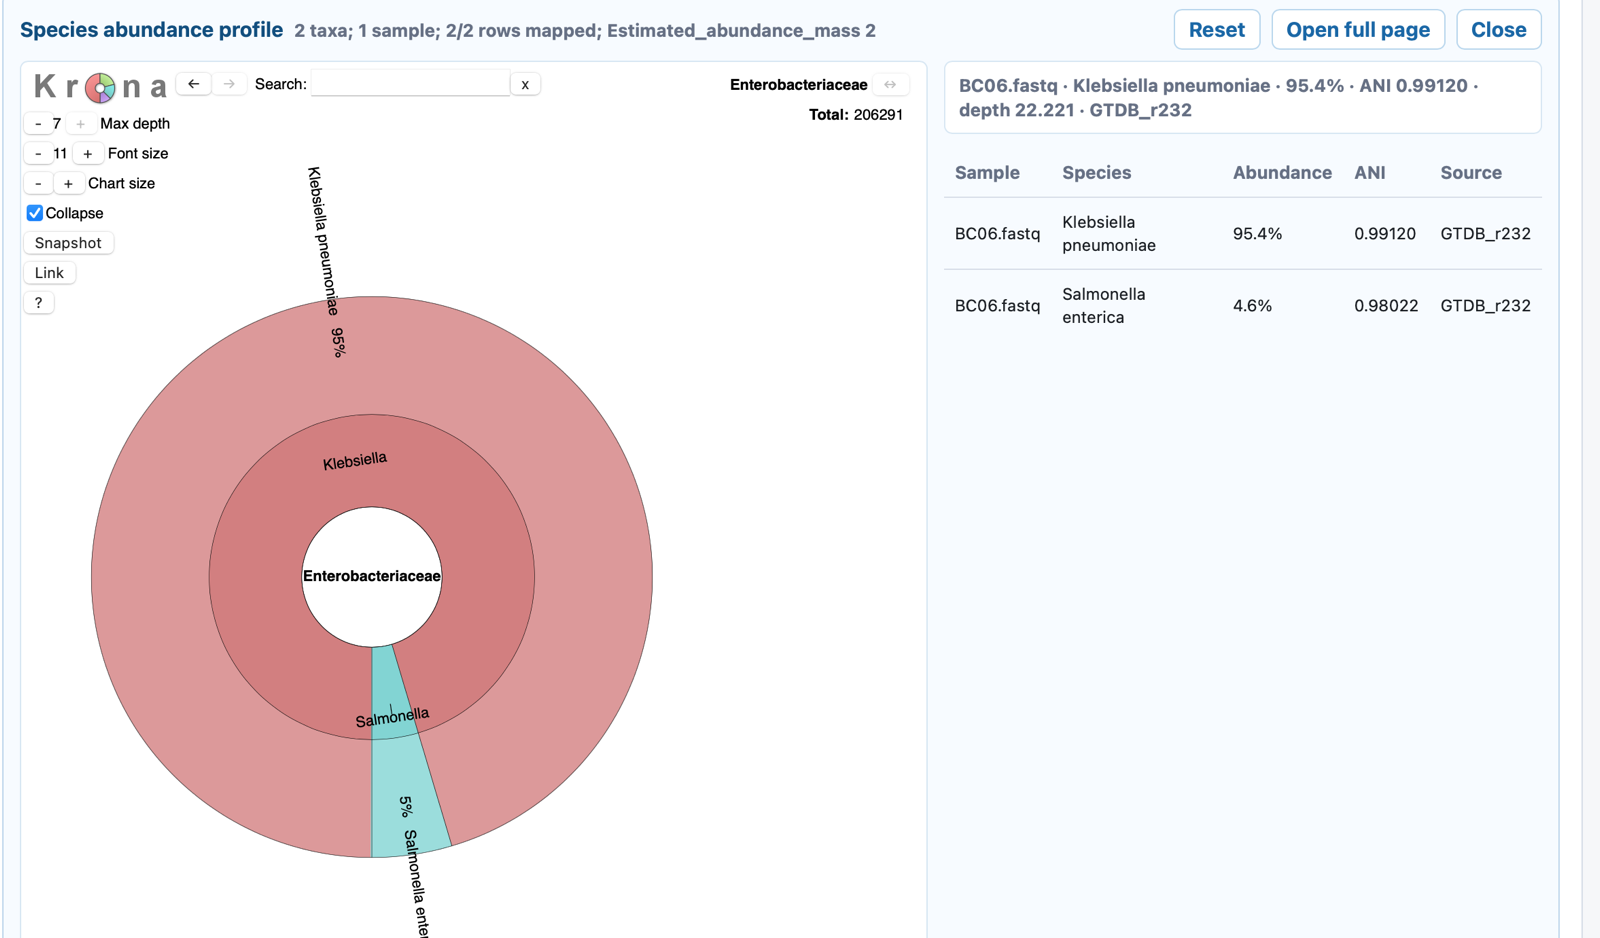
Species
What is in the sample
Relative abundance per species with ANI, so you know the target organism before you interpret the strain result.
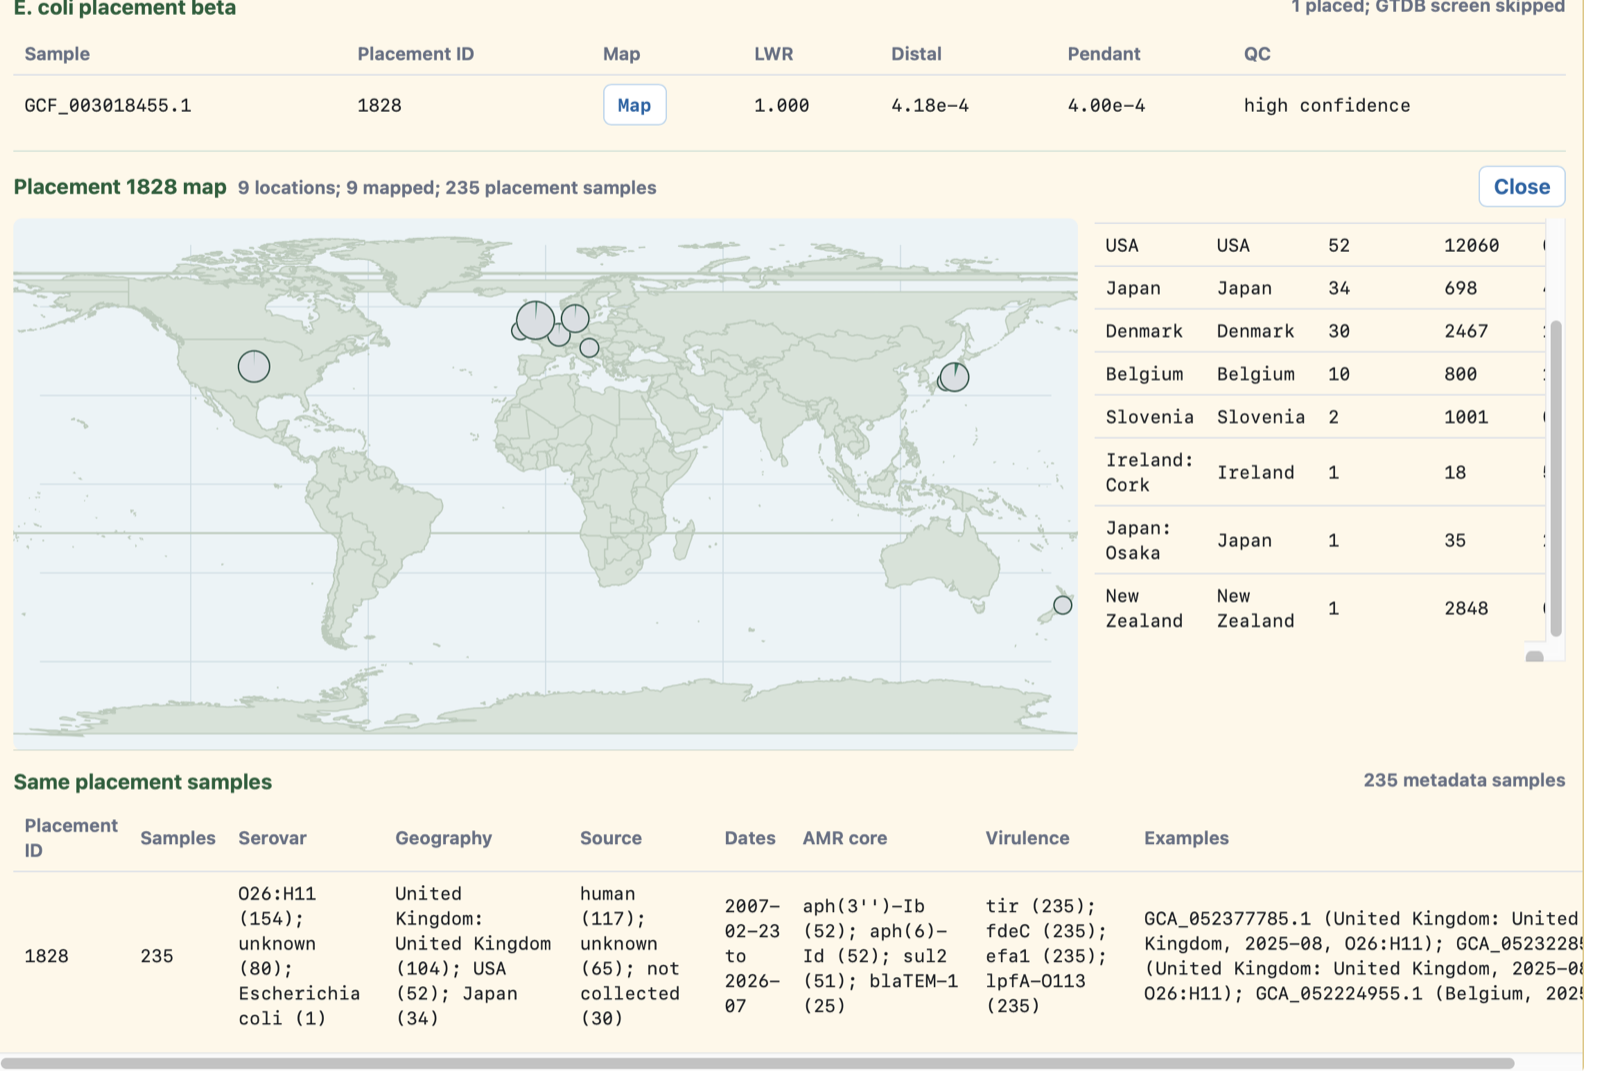
Global
Where else this strain has been seen
One E. coli placement returned 235 related samples across nine countries — with dates, sources and resistance genes attached.
Domestic
Clusters inside your own country
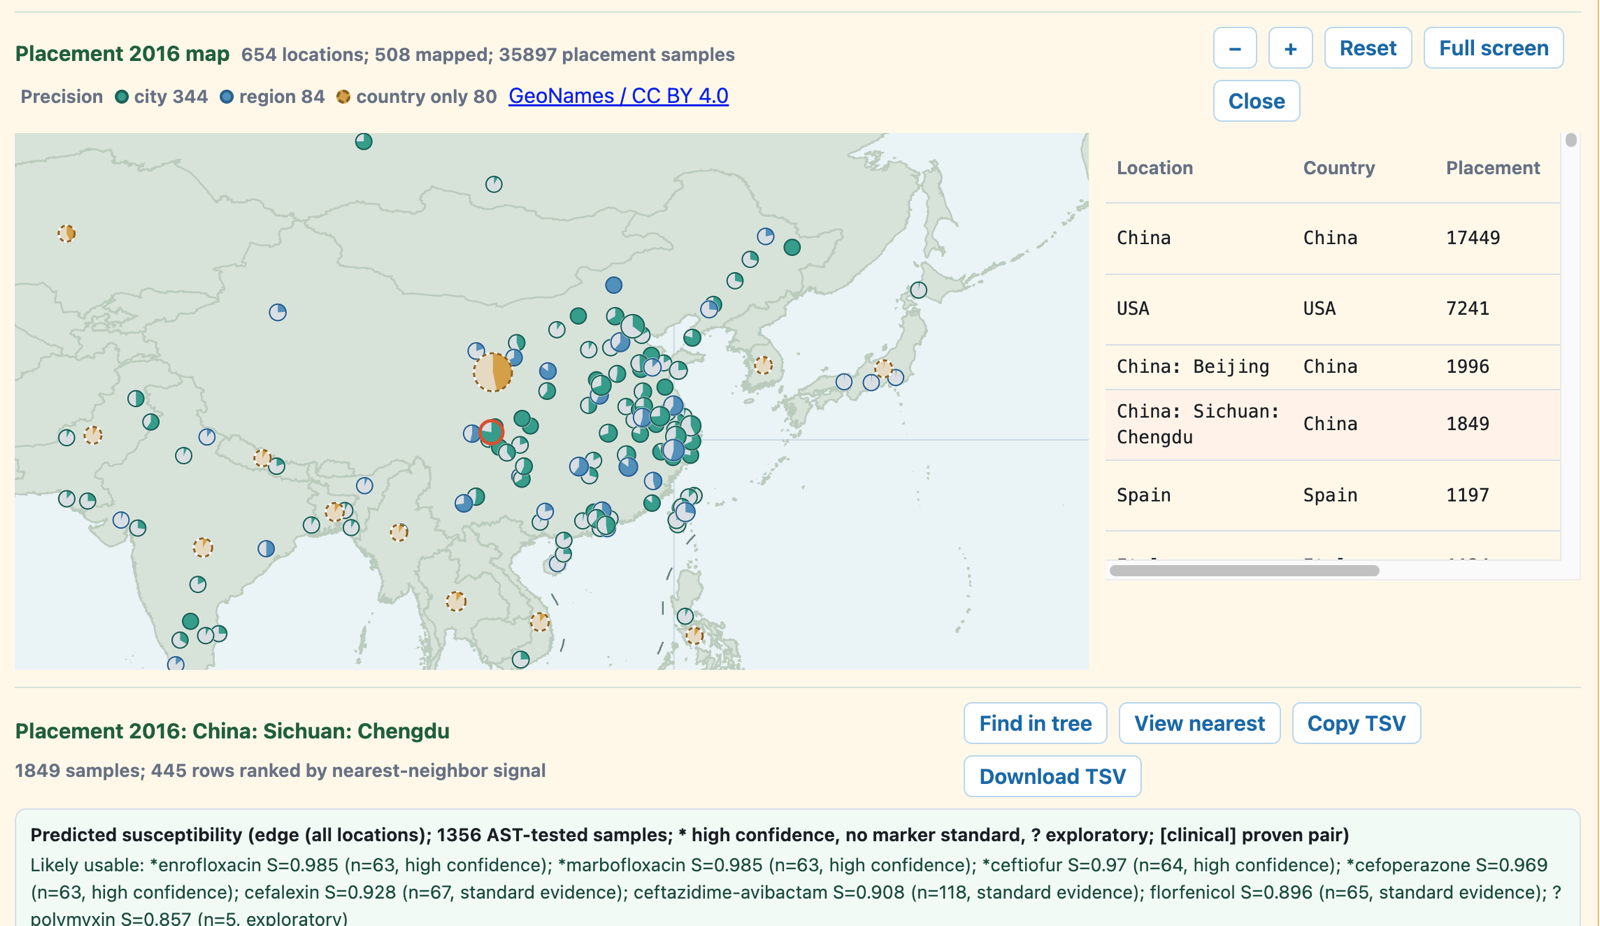
One view covers 654 locations and 35,897 samples. Chengdu, Sichuan alone accounts for 1,849 samples across 445 ranked rows — a signal that is easy to miss when you only see your own laboratory's data.
Resistance
Resistance genes next to measured susceptibility
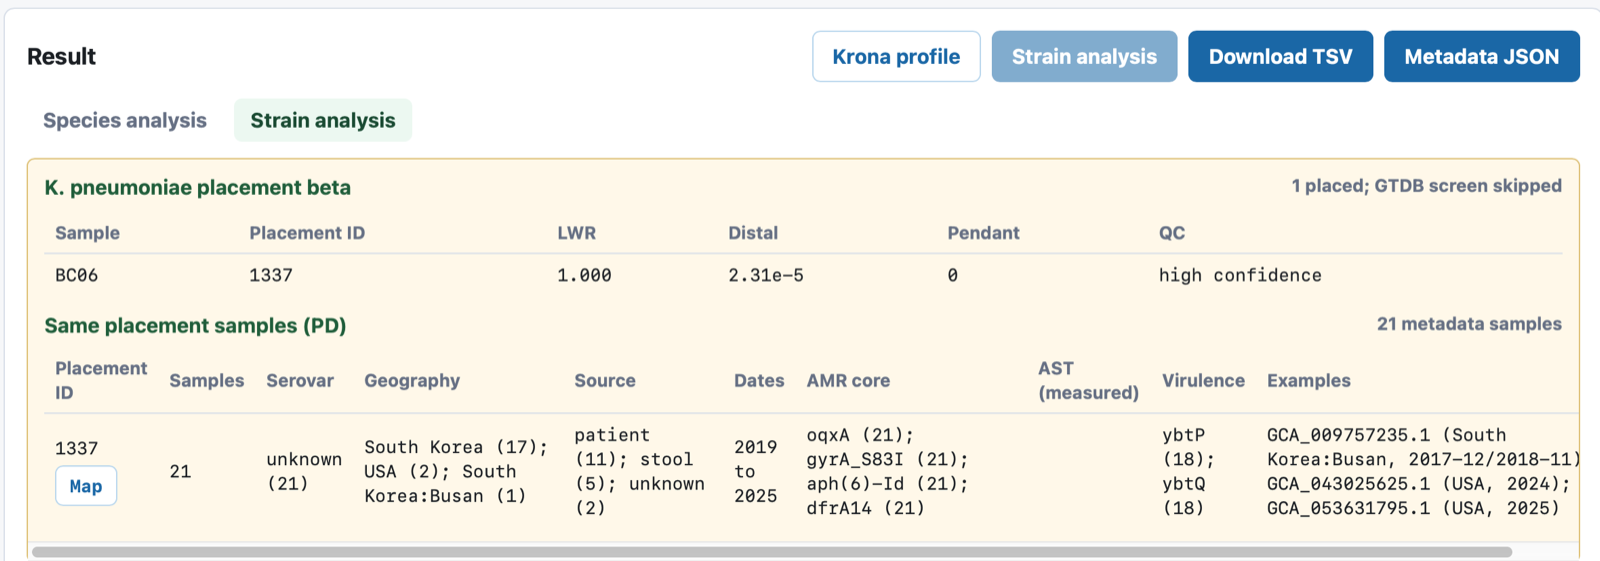
Genotype and phenotype side by side: which resistance genes are present, and what the laboratory actually measured.
For CDC
Built around the questions a CDC actually asks
Not a research tool. Each capability maps to a routine public-health task.
Is this case part of an outbreak?
Place a single isolate against the whole index and see whether it sits inside a known cluster or stands alone.
Cross-region cluster detection
Spot the same strain appearing in two provinces or two countries, before the connection is made by hand.
Antimicrobial resistance surveillance
Track resistance and virulence markers across the matching strain population, alongside measured susceptibility.
Hospital-acquired infection
Confirm whether ward cases share a strain, and whether that strain has been reported by other hospitals.
Foodborne and enteric outbreaks
Link clinical isolates to each other and to food or environmental isolates held by partner agencies.
Imported and cross-border cases
Check a travel-associated case against overseas collections without requesting anyone's raw data.
Reference laboratory support
Give regional labs a fast first-pass placement, so the national reference lab only handles genuine signals.
Rapid response, in hours
Emergency mode surfaces the closest matches first, so an incident team gets a working hypothesis the same day.
Long-term trend reporting
Because every result is exportable, surveillance trends accumulate in your own systems and stay yours.
Governance
Compliance is the architecture, not a setting
The safest data is the data that never moved. SketchHub is designed so that
data-protection review is straightforward.
Data residency by design
Raw sequence data stays under your jurisdiction, your ethics approvals and your national data rules. There is no central genome repository to negotiate over.
Minimal by construction
A sketch is a sampled k-mer profile rather than the sequence itself — a compact summary of the sample, transmitted over an encrypted connection.
You authorise who compares with you
Sharing is a policy decision, not a technical one. You decide which partner institutions may match against your collection — and you can withdraw that at any time.
Auditable transfers
Every sketch submission and every match query is logged. You can produce a complete record of what left your institution and what was asked of it.
Works with your existing pipeline
No new sequencer, no re-analysis of your archive. If you already produce FASTA or FASTQ, you can use SketchHub.
Open result formats
Results export as TSV and metadata JSON, so findings live in your own surveillance systems rather than in a vendor platform.
Live service · open beta
It is running right now — try it with your own sample
The full comparison service is online. Upload a FASTA or FASTQ file and see the matches for
yourself. Nothing to install, nothing to sign up for.
kssd3.genomesketchub.com
Open the platform
This is a beta build. Please read the note below before you rely on a result.
Beta What that means
The service works and is open to anyone, but it is still being finished. Screens, default settings and output formats may change without notice.
Beta Verify before you act
Treat a result as a fast first pass, not a final answer. Confirm anything that would change an operational decision through your existing laboratory and reference channels.
Beta Tell us what breaks
Feedback in beta shapes what gets built. If a screen is confusing, a search is slow, or a result looks wrong, we would rather hear about it early.
Built on published methods. KSSD3 is an established approach to
genome-scale sequence comparison, not a black box invented for this product. The core program and the
search service are complete and running, and the public reference index holds more than 200,000 genomes.
Institutions that want a guided deployment can still
request a pilot.
Pilot programme
Want a guided deployment instead?
A pilot takes about two weeks and requires no change to your sequencing workflow.
You keep every file. We show you what the comparison returns. Or skip ahead and
open the beta yourself — no sign-up needed.
Step 1 · Try the beta. Open the platform, upload a sample and see what comes back. No account required.
Step 2 · One sample. You generate a sketch on your own machine and send only that.
Step 3 · Your results. Review the matches, then decide whether a guided pilot is worth it.
FAQ
The questions reviewers ask first
The service is live at kssd3.genomesketchub.com and is open to anyone as a beta. Upload a FASTA or FASTQ file and you will get matches back. There is nothing to install and no account to create.
The service works and is open to use, but it is still being finished. Screens, defaults and output formats may change without notice, and results should be verified through your own laboratory and reference channels before they inform an operational decision.
No. Raw reads and assemblies stay entirely within your network. A compact sketch is transmitted over an encrypted connection, generated from your data without copying it.
A standard workstation or server plus the FASTA or FASTQ files you already produce — or just a browser if you want to try the hosted beta first. There is no new instrument to buy and no archive to re-process.
Sketches are kilobytes in size, so submission and matching are measured in seconds. The practical limit is your network connection, not the analysis.
Yes, and that is the default. You decide which partner institutions are authorised to match against your collection. You can grant access to a single collaborating laboratory and nobody else, and withdraw it later.
The public reference index currently contains more than 200,000 genomes and is continuously updated. If your organism of interest is not yet represented, the index can be extended.
No. The console takes files in, runs the comparison and returns results with export buttons. Interpretation still benefits from domain expertise, but operating the system does not require it.
A public database requires you to deposit sequence data and wait for it to be released. SketchHub lets you obtain the benefit of comparison — finding related strains — without depositing anything.